
Research

Findings from NAEP, PISA, TIMSS, PIRLS and peer-reviewed research, documenting the relationship between digital device use and academic performance across the United States and the globe.

The NAEP Evidence: When Digital Adoption Aligns with Score Decline

Nebraska's assessment trends don't exist in isolation. Nationally, researchers have documented a striking pattern: across all 50 states, NAEP scores in Math and Reading rose steadily for years — then plateaued and declined in alignment with each state's large-scale digital adoption, not with a single calendar year. This staggered policy adoption design provides strong evidence that the timing of digital lock-in, not external factors, drives the shift.

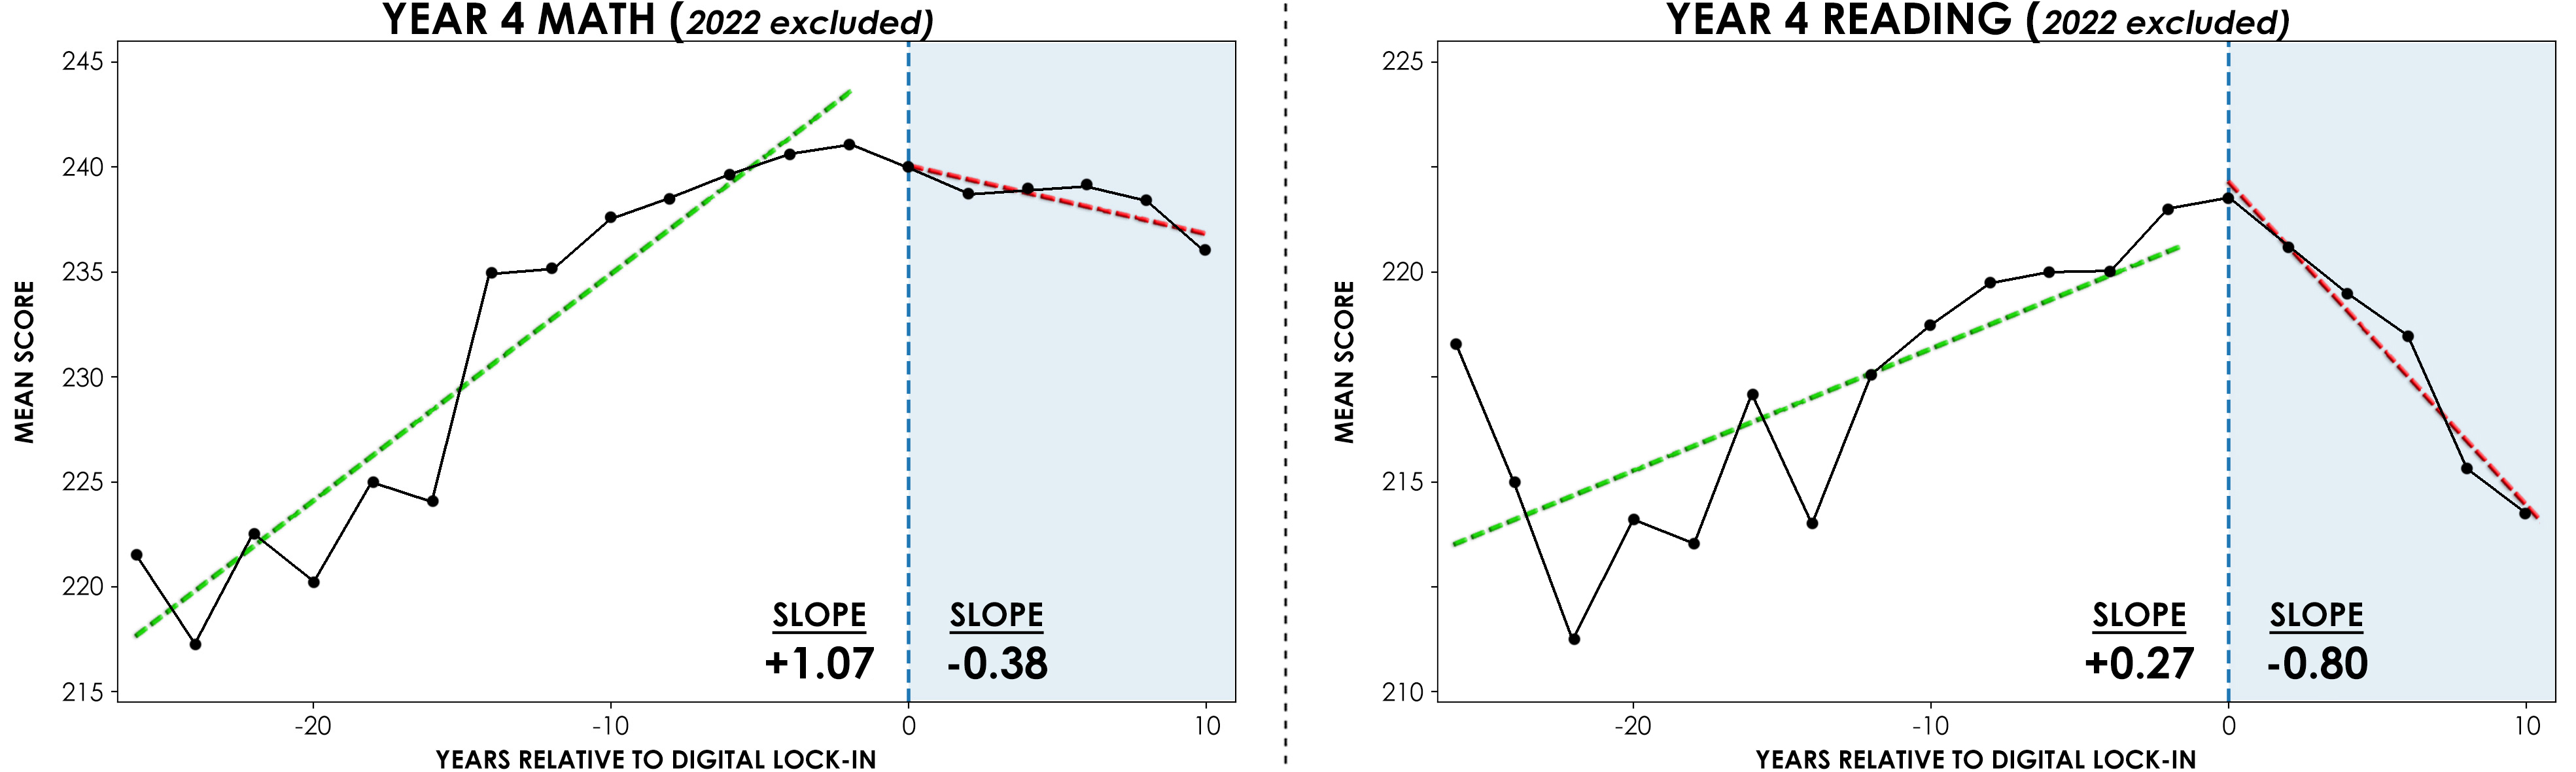
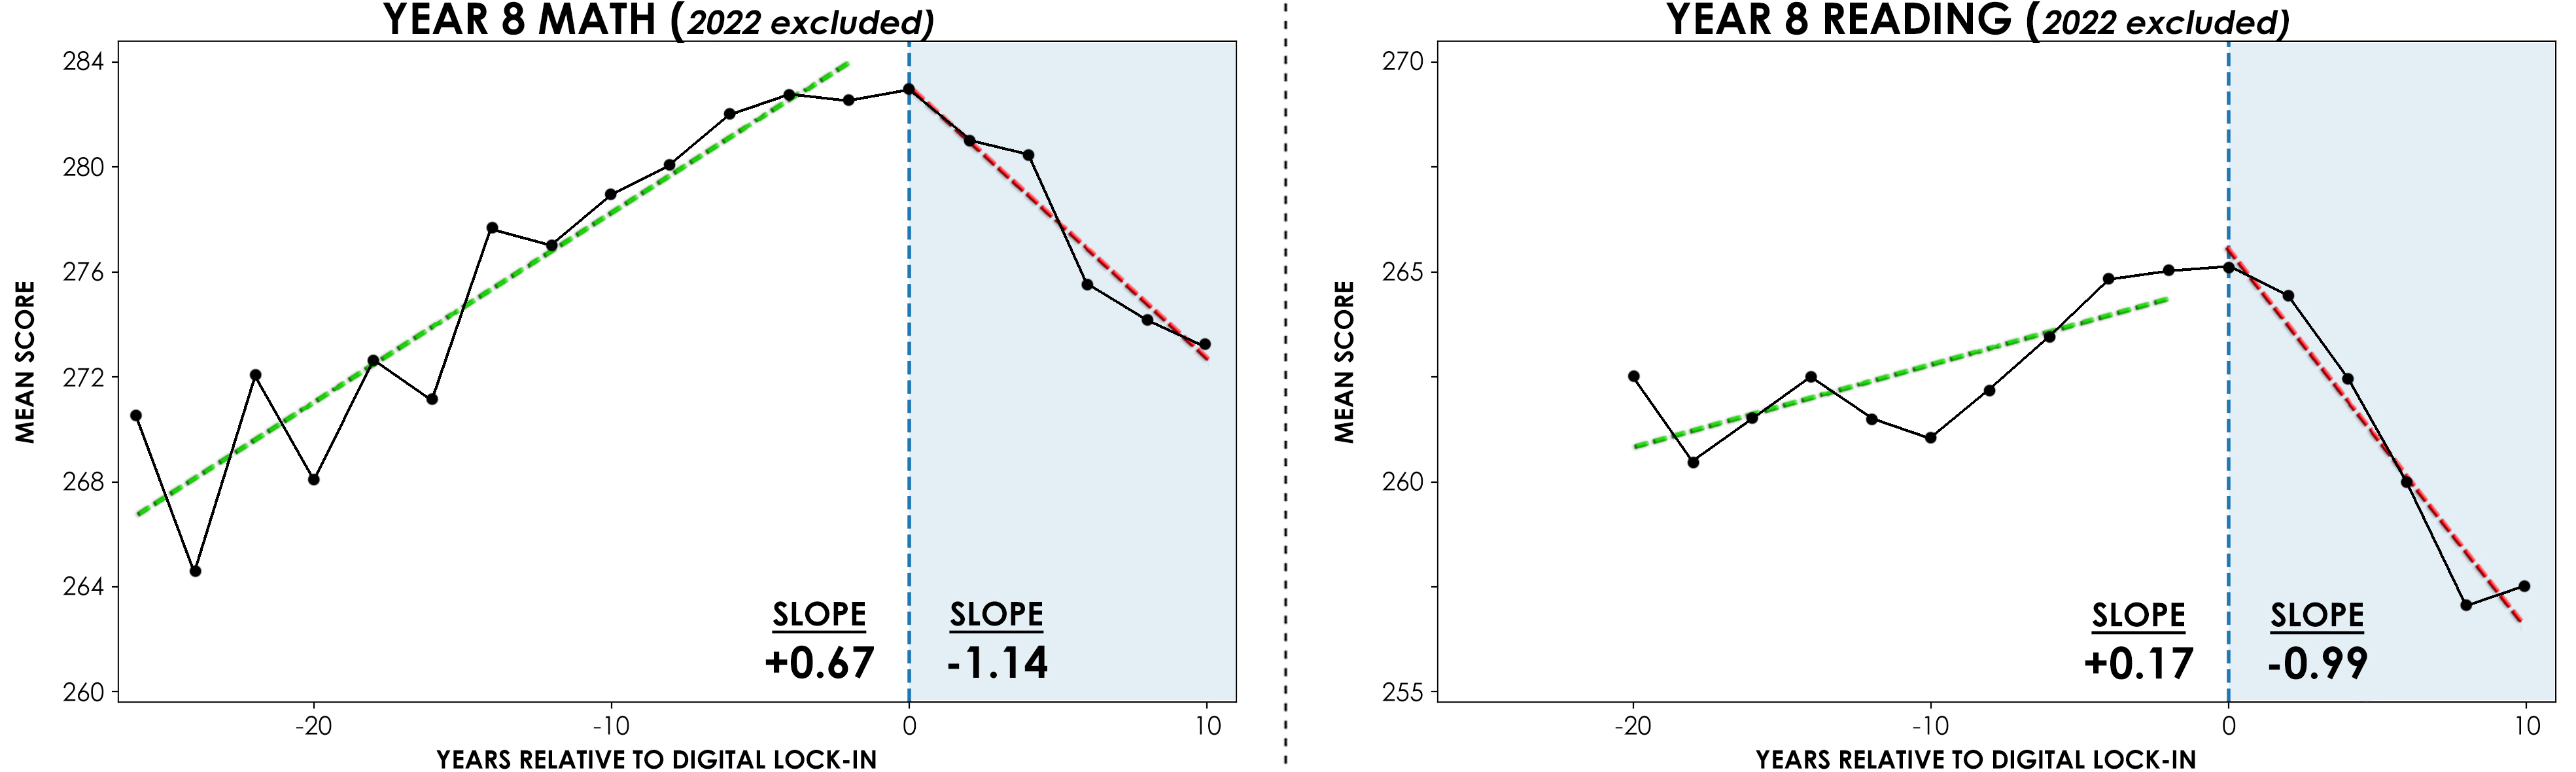
The charts below show national NAEP averages aligned to each state's digital inflection point (Year 0). These results cannot be attributed to COVID because Year 0 for every state occurred before the pandemic and 2022 data was excluded entirely. Unlike most "standardized" educational assessments that periodically reset their scoring scales, NAEP has remained anchored to its original 1992 scale, meaning these declines reflect genuine losses in student learning, not adjustments to the test.
Grade 4 Math

−1.45 pts/yr

post-adoption avg. decline

Grade 4 Reading

−1.07 pts/yr

post-adoption avg. decline

Grade 8 Math

−1.81 pts/yr

post-adoption avg. decline

Grade 8 Reading

−1.16 pts/yr

post-adoption avg. decline

Grade 4 — Math & Reading (2022 excluded)

Grade 4 Math and Reading NAEP trends relative to digital adoption

Math — Pre-adoption

+1.07 pts/yr

Math — Post-adoption

-0.38 pts/yr

Reading — Pre-adoption

+0.27 pts/yr

Reading — Post-adoption

-0.80 pts/yr

Grade 8 — Math & Reading (2022 excluded)

Grade 8 Math and Reading NAEP trends relative to digital adoption

Math — Pre-adoption

+0.67 pts/yr

Math — Post-adoption

-1.14 pts/yr

Reading — Pre-adoption

+0.17 pts/yr

Reading — Post-adoption

-0.99 pts/yr

Note: The national charts utilize a "Year 0" alignment strategy where Year 0 represents the specific year each state reached a threshold of digital device saturation in classrooms. Data via NAEP (National Assessment of Educational Progress).

International Research: Screen Time & Academic Performance

Beyond national trends, a robust body of international research has examined the relationship between digital device use and academic performance. Below are key charts summarizing findings from PISA and OECD data, revealing consistent patterns of negative associations between screen time and student achievement across multiple countries and subjects.

PISA: All Countries — In-School Computer Use vs. Score

PISA longitudinal data (2012–2018) reveals that students exceeding six hours of daily in-school computer use score an average of 66 points lower than non-users, a decline equivalent to two full letter grades.

MATH

READING

Students using screens >6 hours/day scored an average of 66 points lower than non-users — equivalent to a two letter-grade drop (50th → 24th percentile).

OECD Countries — EdTech Access vs. Math Performance Change

Countries that invested more in classroom computers showed greater declines in PISA Math scores (2003 vs. 2012). Adjusted association: −0.57.

TIMSS: All Countries — In-School Computer Use vs. Math Score

Students using computers in class scored ~41 points lower in math than those who rarely used them — a drop from the 50th to the 32nd percentile.

4th Grade Math

8th Grade Math

PIRLS: In-School Computer Use vs. Reading Score

PIRLS assesses 4th grade reading across dozens of countries every 5 years. Pattern mirrors PISA and TIMSS findings.

OECD Countries Only

Time on Digital Devices at School & Mathematics Performance

Based on students' self-reports · OECD average. Learning use declines steadily; leisure use drops sharply after 3 hours.

PARCC Testing Mode Study — Paper vs. Online

A peer-reviewed study published in the Economics of Education Review analyzed nearly 1.2 million student test results across Massachusetts public schools in grades 3 through 8, administering the identical exam in both online and paper formats simultaneously to isolate the effect of the testing mode itself. Students who took the test on a computer scored 0.10 standard deviations lower in math and 0.25 standard deviations lower in English Language Arts compared to students who took the identical test on paper. The ELA penalty alone represents up to 11 months of lost measured learning in a 9-month school year.

Math

English Language Arts

Early Screen Time & Children's Academic Achievement

A 15-year prospective study of 5,400+ Canadian children linked daily screen habits in early childhood to official reading, writing, and math test results in Grades 3 and 6.

~9% lower

chance of meeting grade level per extra hour/day — Gr.3 Reading & Math

~10% lower

chance of meeting grade level per extra hour/day — Gr.6 Math

~23% lower

chance of meeting Gr.3 reading standard — children who play any video games vs. none

5,400+

children tracked from toddlerhood to elementary school, 2008–2023

How to read this chart: Each bar shows how much a child's chance of meeting their grade-level standard drops for each extra hour of that screen type per day. A longer bar = a bigger drop. Faded bars mean the result could be due to chance (not a confirmed finding). Hover any bar to see the exact research figures.

Grade 3 — confirmed findingGrade 6 — confirmed findingResult may be due to chanceNo drop (OR ≥ 1.0)

What this means: Each extra hour of daily screen time is linked to roughly a 9–10% drop in the chances of children meeting their grade level in Reading and Math (Grade 3) and Math (Grade 6). Writing showed no confirmed effect in either grade. These are confirmed findings — the study ruled out chance as the cause.

Statistical note: Percentage estimates are derived from proportional odds ratios reported in Table 3 of Li et al. (JAMA Network Open, 2025). For interpretive clarity, each odds ratio has been converted to an approximate percentage-point change in the likelihood of meeting grade-level standards (e.g., OR = 0.91 ≈ 9% reduction).

EEG Research · NTNU 2024

Handwriting vs. Typewriting

A 256-sensor EEG study recorded brain activity in 36 university students as they wrote or typed the same words. The difference in how the brain engaged was immediate and significant.

During handwriting

16

significant brain connections

During typewriting

0

significant brain connections

Significant clusters found across brain regions32
University students studied with 256-sensor EEG36

Six brain regions

Parietal

Central

Parietal Left

PL · Language & Writing

This region processes written language — connecting letters, words, and meaning. It is active during reading, spelling, and comprehension. Handwriting keeps it highly engaged because each letter must be carefully formed.

What the study found here

Was significantly more engaged during handwriting than typewriting.

What the brain activity means

Theta waves · Working Memory

3.5 – 7.5 Hz

These slow waves are the brain’s way of holding new information in mind and processing it. When theta activity is high, the brain is actively absorbing and organising what it’s encountering — which is exactly what good learning looks like.

Activated only during handwriting — not typewriting.

Alpha waves · Long-Term Memory

8 – 12.5 Hz

Alpha waves are linked to consolidating information into lasting memory. When these connections are strong, what a student learns in class is far more likely to be retained the next day, week, and month.

Activated only during handwriting — not typewriting.

Handwriting activates far more of the brain than typing — specifically the regions and wave patterns linked to memory, attention, and learning. The careful, deliberate act of forming each letter by hand creates a rich network of brain connections that a key press simply cannot replicate.

Source: Van der Weel F.R. and Van der Meer A.L.H. (2024). "Handwriting but not typewriting leads to widespread brain connectivity: a high-density EEG study with implications for the classroom." Frontiers in Psychology, 14:1219945. doi: 10.3389/fpsyg.2023.1219945.